Visualise
Database | Structure | Visualise
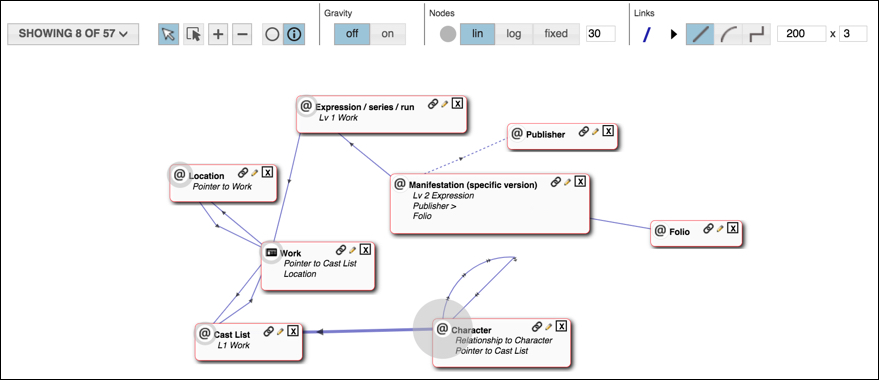
The Visualise view provides a high-level analysis tool for viewing your database structure via the Structure Network Diagram. This spring-loaded type diagram displays an interactive visualisation of your database structure: record types are shown as nodes, and the connections (pointer fields and relationships) as the links between nodes. The thickness of the nodes indicates the number of instances of that record type, while the thickness of the lines indicates the number of connections (relationships and pointers); the arrows indicate direction of connections. Selected entity nodes are also highlighted on the Search Results pane.
Click on a link to view details about the connection (e.g. number of instances).
Note. By default, only used record types are shown, for the current result-set; settings can be changed in the Record Type Table (see below).
Network Diagram Bar

Use the network diagram options to adjust the display settings:
- Showing... Click to toggle the display of the Record Type Table (see Record Type Table below), which shows details of the underlying set of record types. The numbers on the button (e.g. 10 of 30) indicate how many record types are used in the database out of the total number.
- Arrows. Select
 to be able to drag a single node to reposition it. Select
  to be able to lasso multiple nodes to reposition them. (Nodes are repositioned according to the Gravity setting.) Use the + and − buttons to resize the diagram. Alternatively, zoom in and out using the mouse wheel.
 - Info. Toggle
 to show nodes as icons only, or
  to show additional information/actions. When Info is toggled on, record type nodes show additional properties for each record type, including connections to (>) and from. Additional actions might be available, dependent on record type. The Edit icon
  lets you edit the record type (see Define Record Type). The Add Link
  option lets you add a new connection (see Add Link via Network Diagram below).
 - Gravity. Turn on gravity to reposition nodes around a selected entity based on their relative weightings. Tip. Turn on initially. then turn off and reposition manually.
- Nodes. Determines how node size is calculated: lin (based on number of instances), log (logarithmic), or fxed (enter a fixed size). Click
 to adjust the colour.
 - Links. Lines can be straight or curved. The two values
 let you set maximum line length between records, and the maximum width (width is indicative of the number of records in the connected record type, but the maximum width can be set here). Click
  or
or  to adjust the colour of links or arrows.
Add Link via Network Diagram
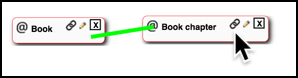
The Add Link option lets you add a new Record Pointer or Relationship Marker connection, as an alternative to adding links via the Record Structure page.
Drag and drop the Add Link icon to another record type to attach the new connection (the line changes from red to green to indicate a successful link). From the dialog, indicate the type of connection, Record Pointer or Relationship Marker:
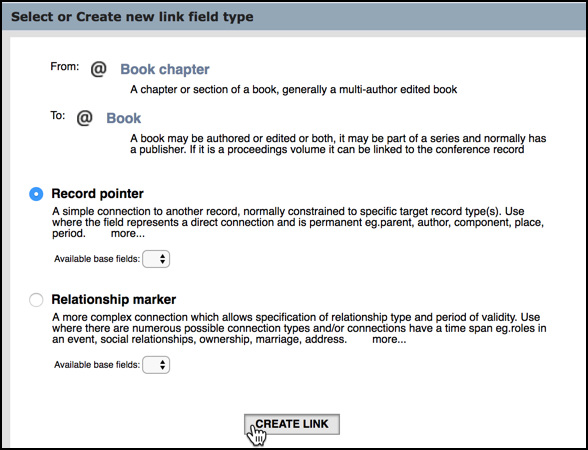
The target record type is selected by default but can be changed. Click Create Link. Complete the properties for the new required connection field. (See Advanced Data Types.)
Record Type Table
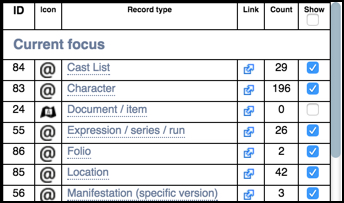
This provides a high level view of your database record types (ordered by group):
- ID. The ID of the record type.
- Icon. The record type icon.
- Record Type. The record type name. Click to open all such records in the Search Results pane.
- Link. Opens record type search results in new window.
- Count. The number of record instances created for this record type.
- Show. Toggle to hide or show record as a node in the Network Diagram (all record types with at least one instance are selected by default).
Created with the Personal Edition of HelpNDoc: Full-featured Documentation generator