Map-Timeline
Analyse | Map-Timeline
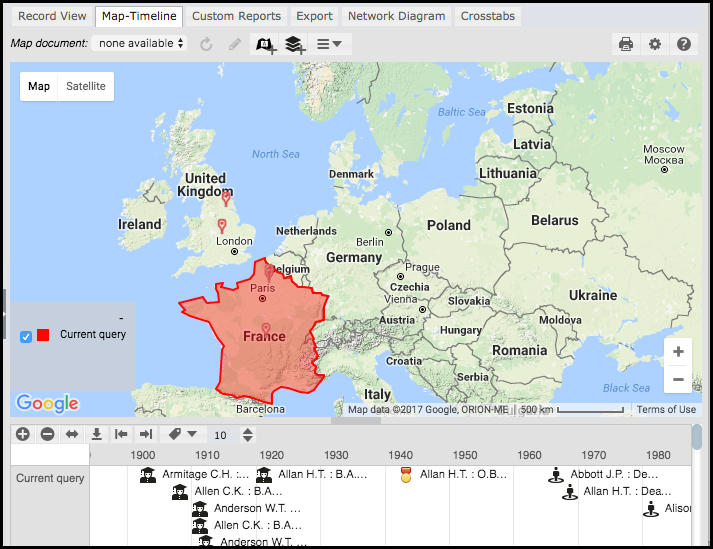
The Map-Timeline view presents geospatial and timeline information stored for the current result-set or a saved map document. If a record type has either or both location (geospatial) and timeline (temporal) data, this information will appear (for all records in the result-set) on the Map section and/or Timeline section, as appropriate.
Note. Data will only appear on the map if geographic objects are included in the record. The number of records shown in the Map View is limited by the number set in your profile. By default this is 500 (i.e. data for only the first 500 records is displayed). Google Maps and VIS Timeline do not work well with large number of objects, and may hang your browser or cause it to report the page as non-responsive. We recommend refining your filters to retrieve fewer records before mapping. You may also change the record limits for map and timeline in Profile | My Preferences. An empty or sparsely populated map will be generated if the search results do not contain any map data.
Map Tools
- To pan the map, click on the map and drag.
- To zoom in/out, use the
 Zoom In and
  Zoom Out buttons, or use the scroll wheel on you mouse.
 - To select objects on an area of the map, use the Polygon and Rectangle tools. Selected objects are also selected on the Search Results Pane.
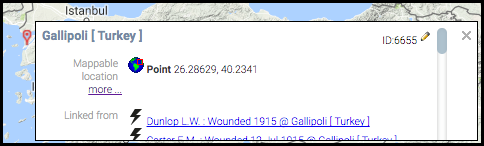
- To view a record's details, click on the record icon.
Map Menu
The following additional options are available from the Menu (top-right of tab):
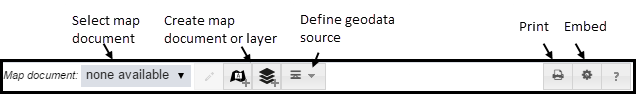
To create and use 'map documents', see Map Documents.
Map / Satellite Views
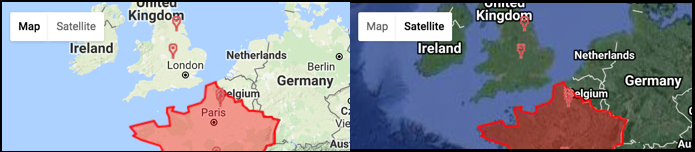
You can toggle between a Map view and Satellite view by clicking on the relevant Map/Satellite button.
Map Layers
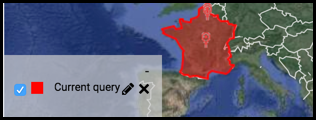
You can view and edit map layers via the Map Layer box (click +/- to open/close). (See Map Documents for creating layers.)
Timeline Tools

Zoom in and out of the timeline (or use the mouse scroll wheel). To pan the timeline, click on the timeline and drag.

These buttons let you zoom/move the timeline to view all of or portions of the timeline data: Zoom to all, Zoom to selection, Move to start and Move to end.

The Label dropdown lets you choose how much of the record labels to display on the timeline. The Value dropdown lets you additionally increase/decrease the number of characters shown on the label.
Setting up for Mapping
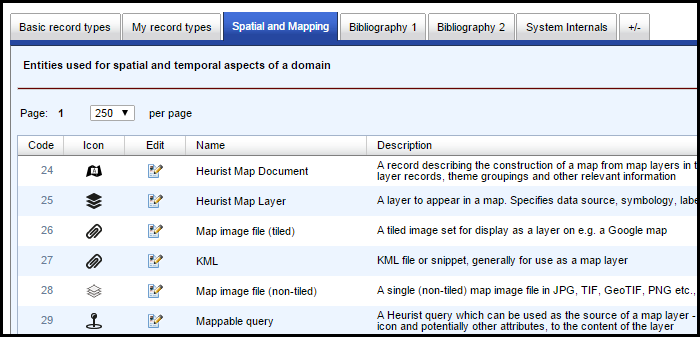
In order to use mapping fully, your database needs to have the following mapping record types:
- Heurist Map Document. This is a record type in Heurist, which describes the map you wish to display. It specifies a series of Map Layers which are to appear on the map, the order in which they appear and general characteristics about the map such as its name, the initial zoom of the map and bookmarks for different areas and sets of layers.
- Heurist Map Layer. This is another record type in Heurist. It specifies a Data Source (see below). It also expresses the way in which the data source is rendered on the map (i.e. its label, symbology, transparency and behaviours such as zoom range).
- Data Sources. These are a set of record types in Heurist. They specify an actual data file or, in the case of KML, they can contain a snippet of KML code in a memo text field. There is a separate record type for each different data file type: Google Maps (KML), Heurist Query, Raster (Tiled Image), geoTiff), Vector (SHP, KML), and potentially other types.
Note. These types are included by default in any new database, and are also available for import from the Heurist Reference Set database (Heurist ID # 3) using the Import Templates option.
You can then take two routes to creating a map document:
- A. From the top: create a map document, then add layers within the document, and data sources within layers (see below)
- B. From the bottom: create data sources, then layers for each data source, then a map document to group the layers.
Creating a Map Document
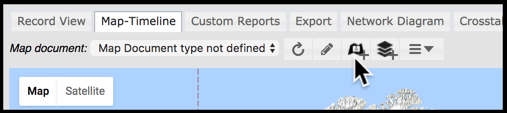
Create the map document, by clicking the Add Map Document button on the Map-Timeline tab (or use the Add Record option).
Note. If the required mapping record types (see above) are not available, then you will get a message to download them from Import Templates. Once you have done this you can return to these steps.
In the Map Document record dialog, name the map and add the map layers:
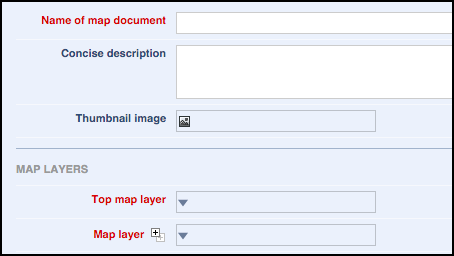
Create a top map layer (at least), by clicking the Top Map Layer field and from the dialog selecting an existing map layer (or to create a new layer at this point click Create new map layer; see Adding a Map Layer below.
Optionally add any additional map layers (using the Map layer repeat field).
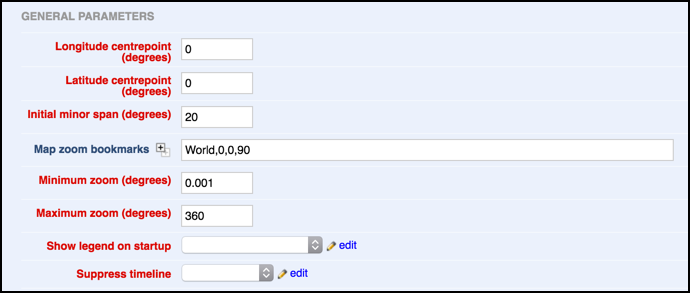
Complete the General Parameters section as appropriate:
When saved, the map document becomes available from the Map Document dropdown, in the Map View.
(You can add additional map documents.)
Adding a Map Layer
You can create map layers from either the Map Document dialog or via the Map-Timeline view | Map Layer button: 
Note. If you create a map layer using the Map Layer button, you will need to add it to any other map documents on which you wish it to appear, by editing each of the map documents in turn.
Complete the layer fields as required:
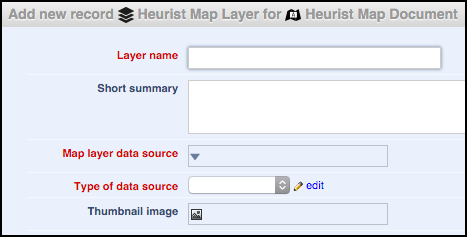
At this stage you will probably need to create a data source for each layer as part of the layer creation process. Later on, you may simply select one of the available Map Layers, or create new Map Layers but select one of the existing Data Sources.
Publishing a Map
To embed a map in a web page, the Publish Map button:  .
.
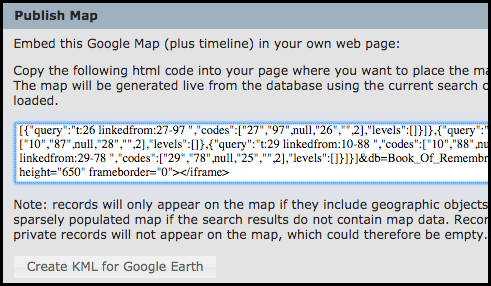
Copy the code generated into the web page where the map is to be placed. The map will be generated live from the database using the current search criteria, reflecting the latest changes to the database.
Created with the Personal Edition of HelpNDoc: Full-featured Kindle eBooks generator