Analyse
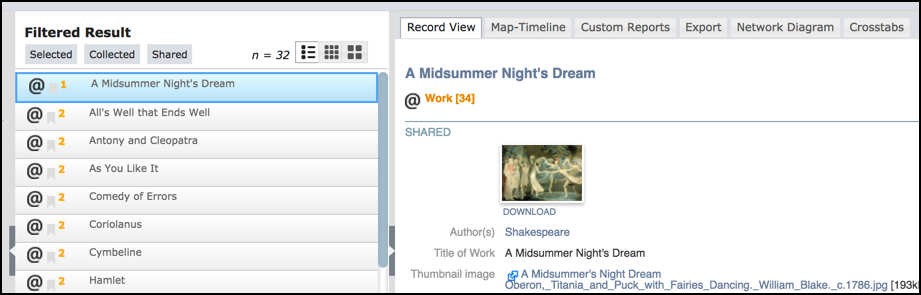
The Viewer Pane provides different ways of analysing and presenting the content of selected records, each tab representing a different view of your data result-set:
- Record View. Provides a basic view of the currently selected record (shared and private data), or the first record in a result-set. It shows the field data and relationships as well as metadata.
- Map-Timeline. Shows map and timeline data if available for records that contain the appropriate mapping fields (i.e. records contain at least one field of type Map or Date/Temporal).
- Custom Reports. Shows report output based on the selected, predefined report template. You can define 'Smarty' reports using Heurist's reporting feature. (See Publish.)
- Export. Provides options for exporting your data (a complete text backup of your data and optionally bookmarked data and attached images) in a range of formats.
- Network Diagrams. Provides an interactive visualisation of your data.
- Crosstabs. Provides a crosstabs analysis of your data. A cross-tabulation is a way of calculating counts of aggregations sorted by category.
- Transforms. Lets you to transform your input data to structured output for tailored structured views of your records by applying additional formatting or processing to the result of a query. The Transforms tab is visible only when transform objects are available in the records.
Created with the Personal Edition of HelpNDoc: Free Kindle producer