The Database Summary option (available from the Navigation Pane and the Database | Analysis menu) provides a high-level analysis tool for viewing your database structure, via the following views:
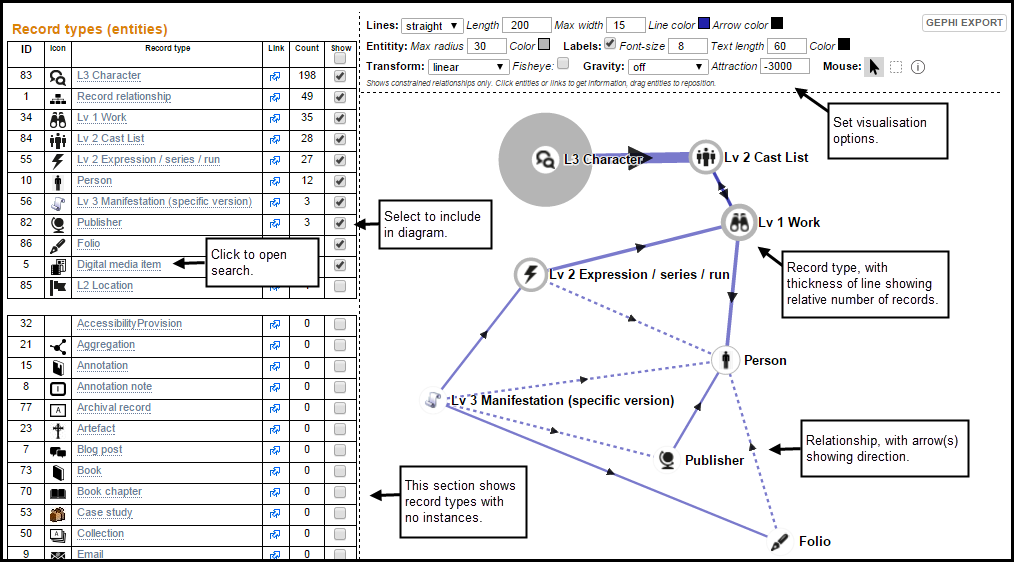
This provides a high level view of your database record types, as follows:
ID |
The ID of the record type. |
Icon |
The record type icon. |
Record Type |
The record type name. Click to open in Search REsults pane. |
Link |
Click to open Search REsults in new window. |
Count |
The number of record instances created for this record type. |
Show |
Select to include the record type in the Connectivity Diagram. Record types with no records are shown in the lowerand are not included by default in the diagram. |
The Network Diagram is a spring-type diagram that displays an interactive visualisation of the record types selected in the Summary Table.
The network diagram shows record types as nodes, and the connections (pointer fields and relationships) as the lines between nodes (edges). Selected entities are shaded blue.
Move the record types to restructure the diagram as you wish.
Use the network diagram options to change the display settings, as follows:
 lets you select and move a single node. Selected entities are shaded blue on the diagram and also on the Search Results pane. The rectangle icon
  lets you select and move a group of nodes. The information icon
  lets you view information about by clicking on a node.
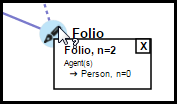
Created with the Personal Edition of HelpNDoc: Free HTML Help documentation generator