The Network view displays a data network diagram that provides an interactive (spring-loaded) visualisation of the (displayed) results set (a 'data' network diagram).
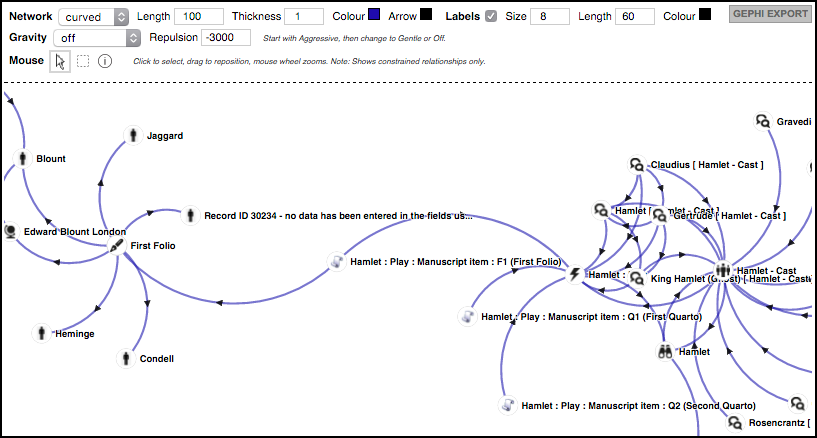
Records are shown as nodes, and the connections (pointer fields and relationships) as the lines between nodes (edges).
Run a search and select the Network tab. The results are shown as a network diagram.
Use the mouse wheel to zoom in and out of the map. Use the Network Diagram options to change the display settings, as follows:
 lets you select and move a single node. Selected entities are shaded blue on the diagram and also on the Search Results pane. The rectangle icon
  lets you select and move a group of nodes. The information icon
  lets you view information about by clicking on a node.
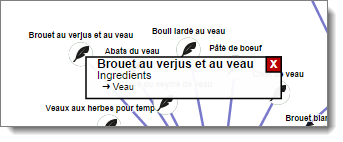
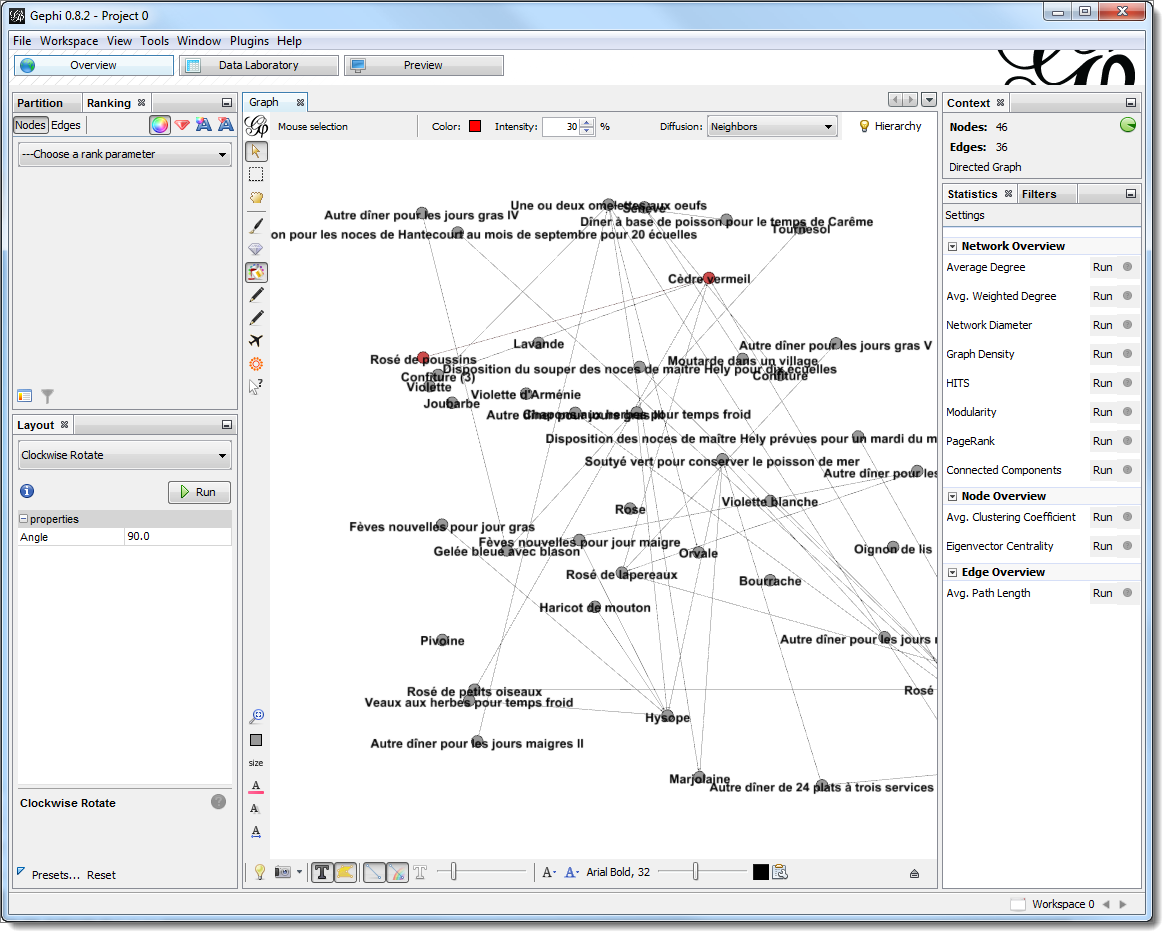
Gephi provides additional sophisticated ways of visualising the data shown in the Connections View.
Note. Gephi is a widely used free, open-source desktop tool that gives great flexibility in the visualisation of networks. To use Gephi you need to have installed it. Further information and download of Gephi is available here.
You can export the network data to a Gephi GEFX file via the Gephi Export button at top-right.
Once you have installed Gephi, clicking on the exported Gephi file will open the data in Gephi, where you have a wide range of options for tailoring and exporting similar diagrams.
Created with the Personal Edition of HelpNDoc: Easily create iPhone documentation