Crosstabs
Analyse | Crosstabs
A cross-tabulation is a way of calculating counts of aggregations sorted by category.
Imagine value (that we set to Var 1) is the value of a colour system that has the entire spectrum of colours encoded as numbers. Numbers that are close to each other represent colours that are close to each other. Imagine that the type field (that we set to Var 2) indicates what material the potsherd is made out of. We can use a cross-tabulation to generate instant categories by splitting up the entire range of entered values into 10 buckets, or deciles. This allows us to see, for example, that the range 100128 ~ 198607 contains the most examples in our database.
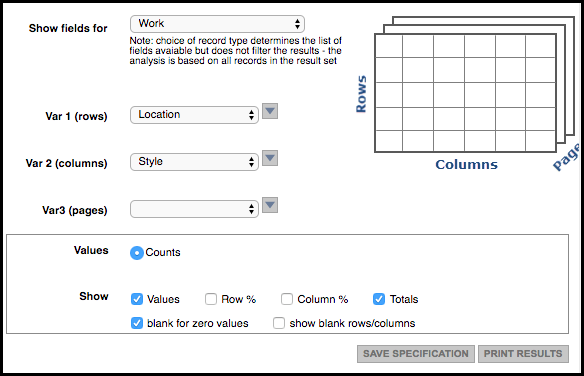
To run a simple cross-tabulation, search for the records you wish to analysis and select Crosstabs. The Crosstabs dialog displays. In the show fields for dropdown, select the record type you wish to analysis. Complete the variables:
- Var 1 (rows) choose your first variable (this will simulate a tabulation by that variable).
- Var 2 (cols) choose the second variable (this splits the range of values into 10 'buckets' and counting how many values appear in each 'bucket' by type.
- Var 3 is an optional variable that breaks the analysis further, into 'pages'.
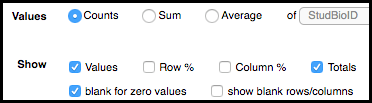
In the lower box, define how you wish the data to be analysed:
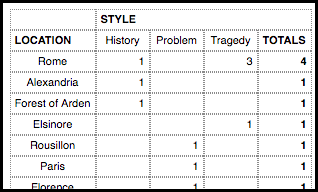
The data tabulation is displayed on-the-fly in the lower part of the page:
You can now save the crosstabs specification and print the results (Save and Print functionality are not yet implemented).
Created with the Personal Edition of HelpNDoc: Free Kindle producer